Legal Operations KPIs That General Counsel Actually Track
Focus on the metrics that survive CFO scrutiny and actually run the department.

General Counsel now track dozens of legal ops metrics, but only a narrow band of them ever make it onto a CFO's slide or a board packet: metrics organized around spend, contract throughput, team capacity, and business alignment. Knowing which numbers survive that scrutiny, and why the rest get cut, is the difference between a dashboard that looks busy and one that actually runs a department.
Legal Ops Metrics as a Distinct Discipline from Legal Practice
Legal ops metrics answer one question, and it isn't a legal question: is the department running well as a business function. Win rates, litigation outcomes, and risk exposure stay with the lawyers, because those are judgments about legal substance, not operational performance.
A second line runs underneath that first one. Law firms measure revenue and utilization; in-house departments measure cost and throughput.
Confusing the categories is exactly how a legal ops dashboard ends up bloated and useless. The slides looked sharp. Then her CFO asked a question about outside counsel spend, and none of the seventeen KPIs could answer him 2025 ACC Chief Legal Officers Survey. That's the failure mode this piece exists to prevent.
The Thomson Reuters Institute offers a cleaner way to sort the noise: metrics should serve one of four purposes, making the department more effective, more efficient, better at protecting the business, or better at enabling it. That framework does the organizing work for everything that follows.
The demand-spend-headcount gap that makes KPI selection urgent right now
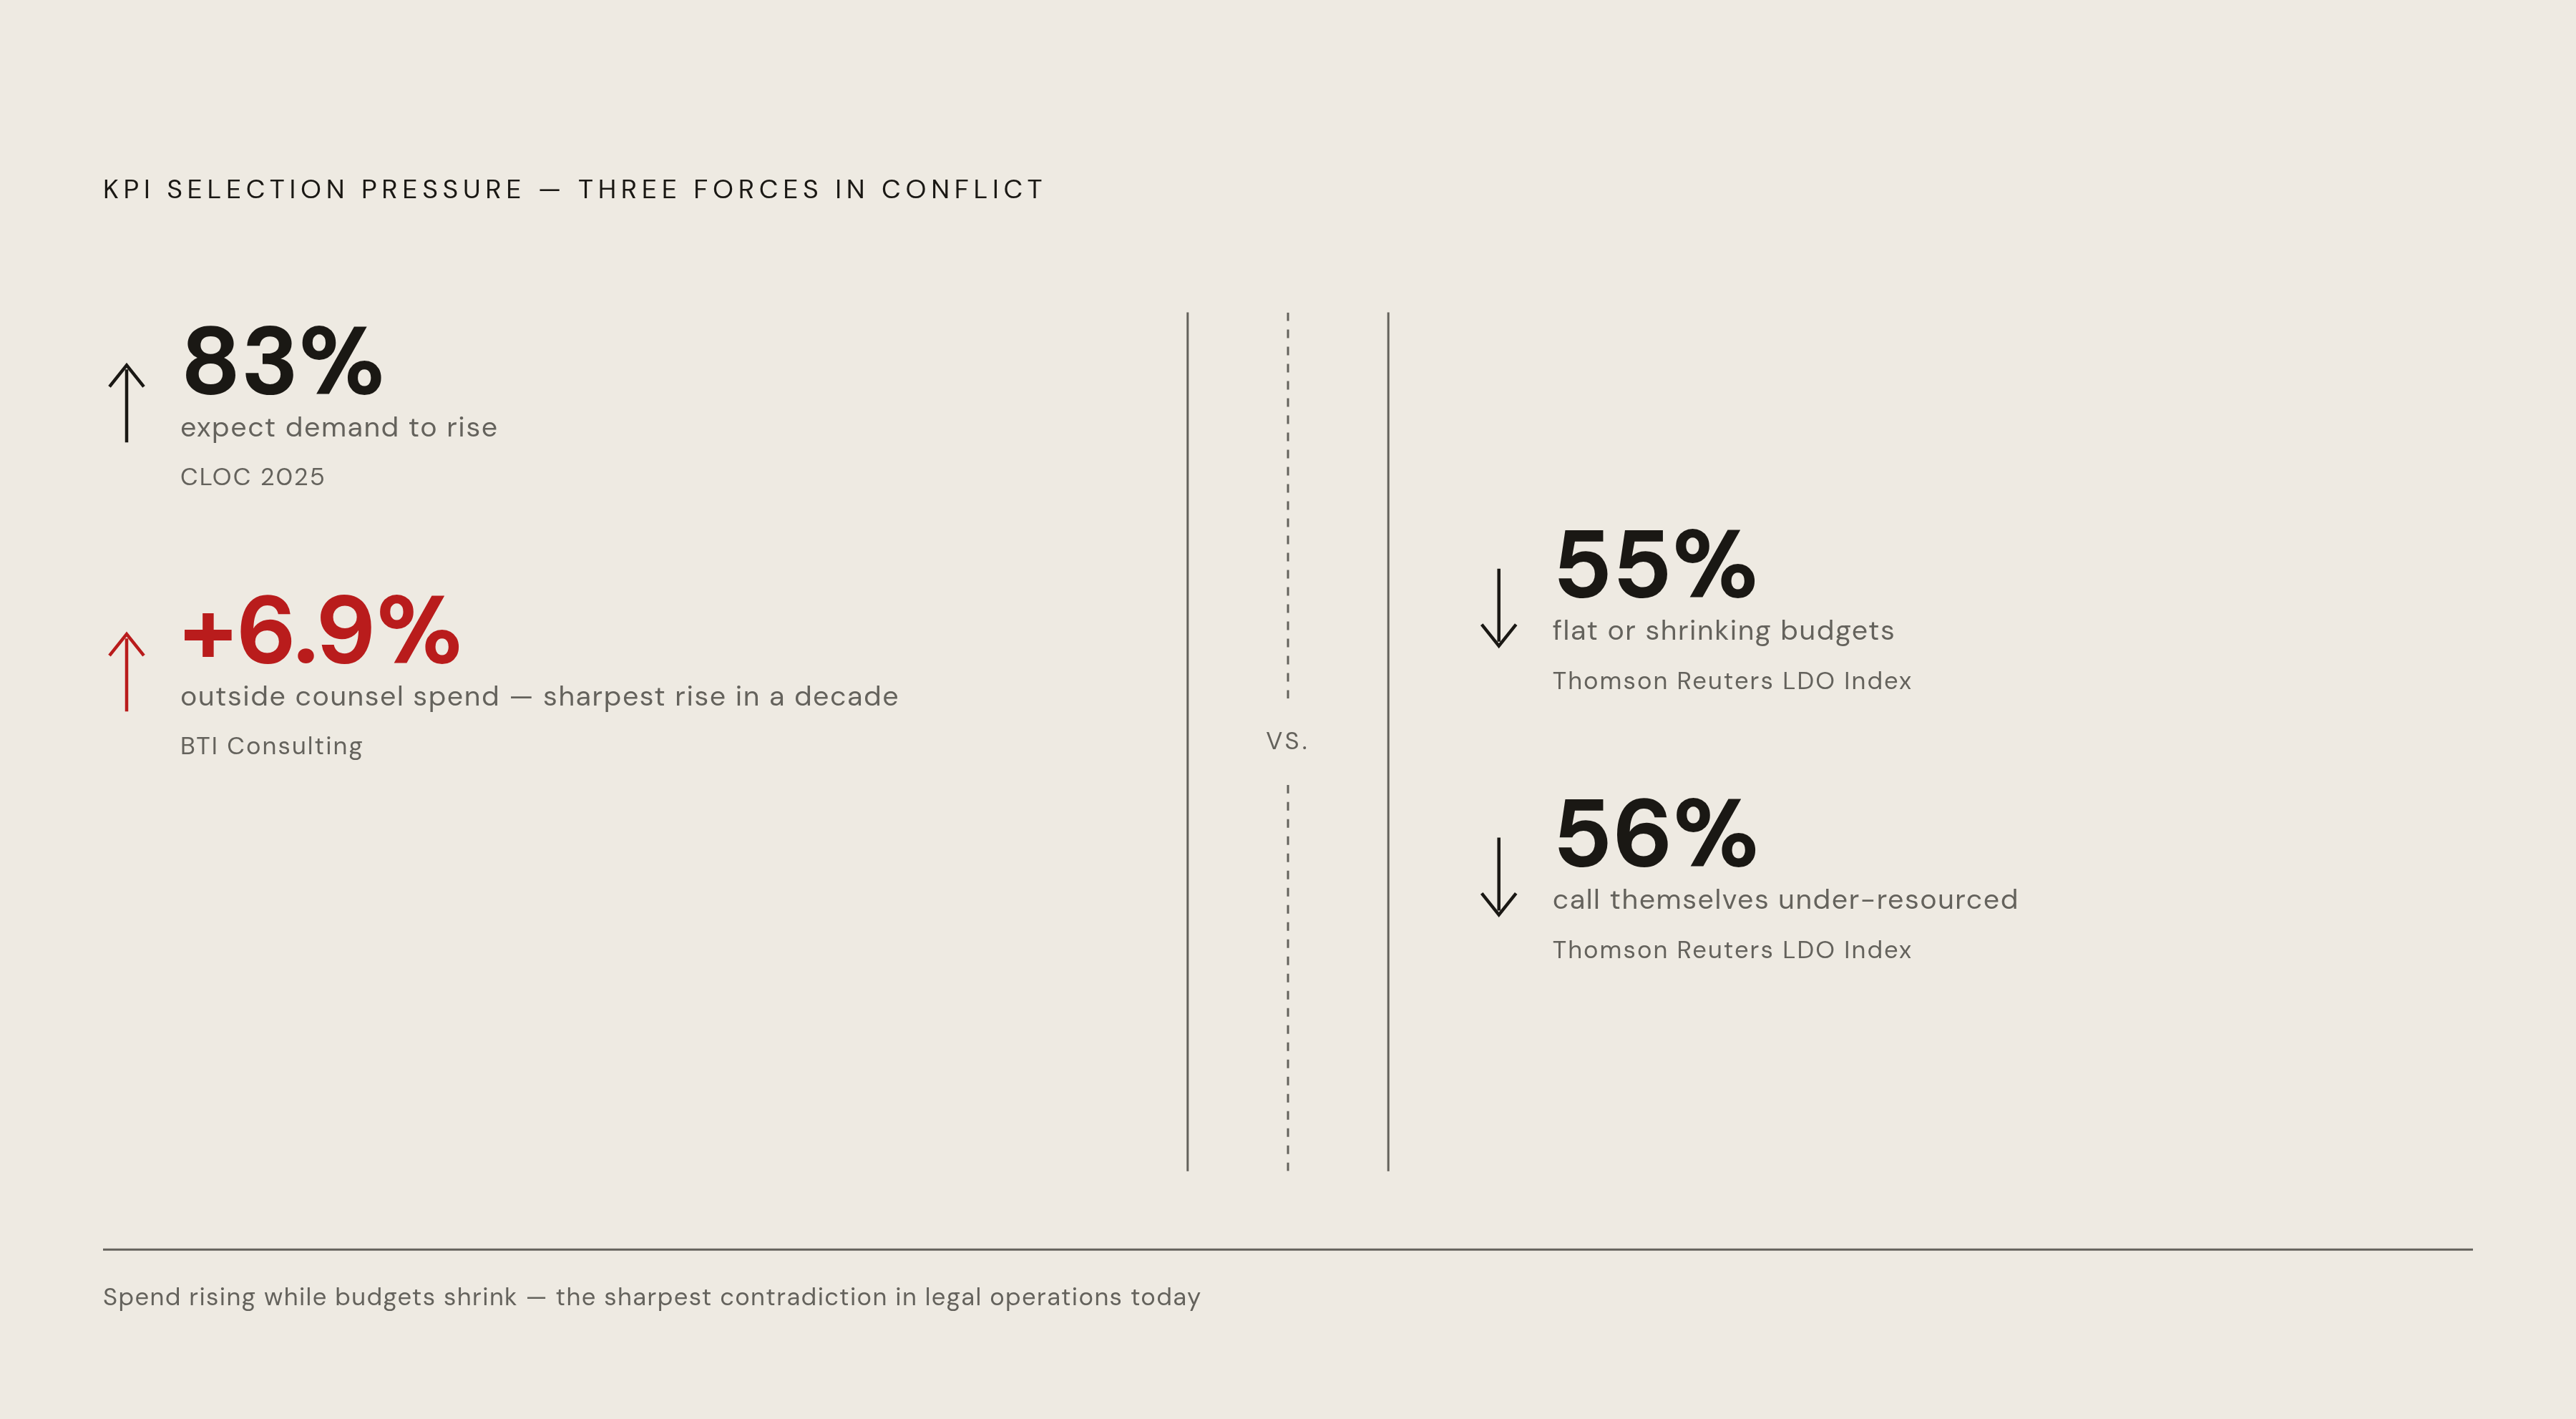
CLOC's 2025 State of the Industry Report found 83% of legal departments expect demand to rise, and 63% already name workload and resource bandwidth their top challenge CLOC 2025 State of the Industry Report 2025 ACC/MLA Benchmarking Report. Thomson Reuters' 2025 LDO Index, drawing on more than 125 legal department professionals, found 56% call themselves under-resourced, 46% expect more work to move in-house, and 55% report flat or shrinking budgets Thomson Reuters 2025 LDO Index 2025 ACC/MLA Benchmarking Report.
Spend keeps climbing anyway. BTI Consulting's Practice Outlook 2025 put corporate counsel on track to add 6.9% to outside counsel spending in a single year, the sharpest jump in a decade BTI Consulting Practice Outlook 2025.
Put those pieces together and the shape of the problem is plain: more work coming in, budgets staying flat or shrinking, and outside spend rising regardless. Dashboards built years ago for a calmer environment can't tell a CFO or a board whether any of that is going well. That gap is what turns KPI selection from a housekeeping task into something closer to a board-facing obligation.
The instinct to respond by adding more metrics is exactly backward. A KPI earns its spot on the short list only if the team can influence the number within 90 days, the number maps to a business outcome, and the underlying work is in the team's own lane. Everything in the sections below gets filtered through that test. Legal ops teams are currently operating within a macro context defined by the three most recent primary surveys. The "too many KPIs" trap holds that a department tracking more than roughly a handful of KPIs is reporting on the past, whereas three to five lets you manage forward, a principle that organizes the rest of the article.
How to tell a KPI from a metric (and why the distinction determines what survives a CFO review)
Wolters Kluwer and ELM Amplify laid out a three-stage hierarchy in 2025. At the bottom sits data: raw facts like time entries, invoice line items, matter types, where the only job is keeping the format clean and consistent. One level up are metrics, quantitative rollups of that data, total legal spend, spend by practice area, matters opened per month, useful mainly for spotting trends and outliers. KPIs sit at the top, and what separates them from ordinary metrics is a tie to a specific business goal: a metric becomes a KPI the moment it starts tracking progress toward something the department is trying to achieve, like the percentage of matters running under alternative fee arrangements or a targeted cut in contract cycle time.
Matter volume, hours worked, and tickets closed are activity counts. They measure motion, not value, and they stay on dashboards mainly because they're easy to pull from a case management system, not because anyone uses them to decide anything 2025 ACC Chief Legal Officers Survey. A CFO paying attention can tell the difference in seconds, which is exactly what happened with the seventeen-KPI dashboard mentioned earlier 2025 ACC Chief Legal Officers Survey.
Wolters Kluwer's own example makes the mechanism concrete. Panel firm use rate is just a number on its own, but once a department sets out to consolidate its outside counsel roster, that same number starts driving behavior, because now it's measuring progress toward a named objective rather than just describing the past. That's the whole trick: attach the metric to a goal, and it becomes a KPI.
Clean data is the foundation none of this works without. Inconsistent billing codes and vague matter-type structures make metrics unreliable, and once leadership starts questioning whether the numbers are even right, the strategic conversation never gets off the ground. The Thomson Reuters Institute found fewer than 20% of legal departments even capture service-centric metrics like quality of legal outcomes, cycle time, or costs avoided, which says a lot about how far the field still has to go before KPI maturity is the norm rather than the exception.
Spend metrics: the category that earns a CFO slide by default
ACC/MLA benchmarking data shows the ratio of legal spend to revenue moved from 0.56% to 0.63% in the 2023 reported period before declining to 0.50% in the 2024 report, a directional signal that spend is rising faster than revenue CLOC 2025 State of the Industry Report Thomson Reuters 2025 LDO Index ACC benchmarking data. Where a given company falls on that scale depends heavily on industry: financial services and other heavily regulated sectors are toward the high end, while technology and SaaS companies tend toward the low end, and a GC walking into a board meeting needs to know which peer set the CFO is benchmarking against. The ACC/MLA 2024 benchmarking report put average annual legal spend at $3.8 million, up from $3.1 million the year before.
The split between inside and outside counsel spend is the second number to watch closely, because it's the primary lever a department actually has for controlling cost. On average, 53% of legal spend goes to internal costs, but that average hides a lot of variation by company size Legal Dive / ACC benchmarking data. Organizations under $3 billion in revenue keep roughly 62% of spend internal and send 38% outside; organizations over $40 billion flip that pattern, pushing 54% of spend externally 2025 ACC/MLA Benchmarking Report CLOC 2025 State of the Industry Report World Commerce and Contracting Association. Shifting work in-house changes the numerator in that ratio without necessarily touching the overall budget, which is exactly why it deserves tracking on its own.
Panel consolidation is a cleaner signal of vendor discipline than most departments give it credit for. The 2025 ACC Chief Legal Officers Survey, covering more than 1,000 CLOs across 28 industries, found the median number of firms used dropped from 14 to 10, even as 45% of CLOs planned to increase outside counsel spend, a 17-point jump from the year before 2025 ACC/MLA Benchmarking Report Thomson Reuters 2025 LDO Index. Fewer firms getting more money is not automatically a problem, but tracking it tells leadership whether consolidation is buying real leverage or just building dependency on a smaller group of vendors. 95% of departments already name outside counsel and vendor management as a core legal ops responsibility, so this isn't a fringe concern, it's close to universal 2025 ACC/MLA Benchmarking Report CLOC 2025 State of the Industry Report.
E-billing invoice rejection rate is a smaller number that carries outsized meaning. Rejection rates climbed from 11% to 18% in 2025, and law firm invoice rejection rates rose 64% across roughly 400 firms over the same stretch, driven partly by AI-assisted invoice review catching billing guideline violations before payment goes out 2025 ACC/MLA Benchmarking Report Legal billing data. That rise is evidence of tighter enforcement, and it should be reported alongside total dollars recovered from rejected invoices so the business impact is visible.
Alternative fee arrangement adoption, the share of outside counsel spend running through fixed, capped, blended, or success-fee structures, is the metric that turns cost control into leverage. Higher AFA adoption means steadier, more predictable costs and stronger footing in fee negotiations, and both BTI Consulting and CLOC track it as part of their annual legal-market research. Wolters Kluwer points to "percentage of matters with budget" and "percentage of matters using AFAs" as KPIs that push a department's vendor strategy forward rather than just describing it after the fact. Rounding out the category is outside counsel spend per company FTE, one of the six metrics Vaquill flags as worth a board slide heading into 2026, because normalizing spend against headcount lets a CFO track efficiency rather than raw volume.
Contract velocity metrics: where legal ops most visibly either enables or throttles the business
Contract turnaround time, the full stretch from initial request to fully executed agreement, is where legal ops either speeds the business up or visibly slows it down. The 2026 Contracting Benchmark Report puts the average at 35 days to execute, a number that gives any GC a concrete market position to measure against. Slow contract cycles delay revenue recognition, strain partner relationships, and create friction with sales and procurement teams who are waiting on legal to finish, which is exactly why this metric survives a CFO review when so many others don't: the line from cycle time to revenue is direct and easy to explain.
The cost of getting this wrong is the business case for measuring it in the first place. World Commerce and Contracting found poor contract management costs organizations an average of 9.2% of annual revenue World Commerce & Contracting. On a per-contract basis, a low-risk agreement runs about $6,900 to process, while a complex one can cost $49,000, and that per-contract cost has climbed 38% over six years 2025 ACC/MLA Benchmarking Report CLOC 2025 State of the Industry Report World Commerce and Contracting Association. Those figures are what justify spending money on process fixes and contract technology in the first place, since the alternative cost is already baked into the current, slower way of doing things.
A handful of sub-metrics explain where the delay in the headline cycle time number is actually coming from. Tracking negotiation and revision volume, how many versions a contract goes through and how long each round takes, shows whether the bottleneck sits in legal review, counterparty redlines, or internal sign-off. The share of agreements running on company paper versus third-party paper shortens negotiation and lowers risk, and it's a process lever legal ops can pull directly rather than waiting on someone else. Approval times from non-legal functions, account management, product, infosec, matter as well, because surfacing them gives leadership visibility into blockers outside legal's control.
Self-serve resolution rate, the share of routine requests closed out through templates, portals, or automated workflows without an attorney touching them, bridges two categories at once 2025 ACC Chief Legal Officers Survey. Vaquill identifies this as one of the six metrics worth a board slide in 2026. A concrete version of this appears at Juro, where general counsel Michael Haynes rebuilt the company's MSA template with one goal: strip out the language that was generating friction in negotiations. The result was fewer negotiation rounds and faster approvals, a direct, traceable line from a process change to a measurable KPI outcome.
Capacity and throughput metrics: the numbers that answer the headcount question
Matter throughput per in-house attorney starts to answer the question every GC eventually gets asked directly: do you actually need more headcount, or are existing resources being used badly, with industry variance as of early 2026 that a GC should keep in mind when presenting to a CFO who will benchmark against peers. Throughput sets the ceiling on capacity, and cycle time shows that ceiling is being hit or not.
Hours recovered per workflow, tracked against a defined reporting period, tells you whether a new tool or process actually freed up capacity or just moved the work around. GC AI's guidance here is specific: measure staff time before and after a workflow change, count the time spent checking the tool's output as part of the cost, and track what the team actually does with the hours it gets back. That last discipline, accounting for checking time, is what keeps ROI claims honest instead of inflated. GC AI itself is used by more than 2,100 legal teams, including Hitachi, Logitech, Nestlé, Bass Pro Shops, and TIME, and its Playbooks feature applies standing contract guidance to repeatable reviews, which makes it a workable instrument for measuring review time, quality, and cost inside a single workflow 2025 ACC Chief Legal Officers Survey.
Open request age, measured in business days for anything sitting past an agreed threshold, catches the backlog that a simple completed-item report misses entirely. A department can post strong close rates on paper while a cluster of complex matters quietly ages in the background, invisible until someone finally asks about them. GC AI's own scorecard framework uses this number to feed the decision about when to escalate a matter, not just the slide deck that gets built afterward.
Substantive rework rate, the share of reviewed contracts needing a defined correction after that first review, is the quality check that has to travel alongside every speed metric on this list. If a workflow gets faster but rework climbs at the same time, capacity hasn't actually improved, the errors have just moved further downstream where they cost more to fix.
Tracking matter volume by itself, disconnected from cycle time or throughput, is probably the single most common way a legal ops team ends up with activity data that only looks like performance data. Volume tells you the team is busy. It says nothing about whether that busyness is producing anything.
That gap between activity and outcome is exactly where the industry currently sits with technology adoption. In the Thomson Reuters 2025 LDO Index, 73% of respondents say they plan to use advanced technology to automate legal work and cut costs, yet 45% describe the pace of technological change inside their own departments as slow 2025 ACC Chief Legal Officers Survey 2025 ACC/MLA Benchmarking Report. Closing that gap requires a baseline. No department can credibly claim technology delivered a return without first knowing what capacity looked like before the tool arrived. Distinct from contract CTT, this metric covers the full range of legal work.
Business-alignment metrics: the category most departments skip and CFOs ask about anyway
Vaquill lists cross-functional NPS as one of six board-slide metrics in 2026, notable because it is qualitative in origin but quantitative in reporting. The earlier seventeen-KPI dashboard actually included an NPS figure, 41, but it came from just 23 of 140 stakeholders who bothered to respond 2025 ACC Chief Legal Officers Survey ACC/Major, Lindsey & Africa Law Department Management Benchmarking Report. The metric itself wasn't the problem; the sample size and the survey design were. A cross-functional NPS only carries weight if the underlying survey is built to be credible in the first place. Wolters Kluwer treats internal legal NPS scores the same way, as a KPI that pushes strategy forward for the business rather than something that belongs only in an annual review buried in an appendix.
Litigation reserves measured against actual outcomes is another of Vaquill's six board-slide metrics, and it tracks something specific: how accurately a department forecasts the cost and resolution of its litigation. A reserve-to-outcome ratio that consistently skews in one direction is a signal either way, whether it points to overly conservative forecasting, which is a CFO's concern, or weak matter assessment, which is a legal concern, the number is actionable regardless of which direction it leans.
None of this is happening in a vacuum. ACC/MLA 2025 data shows a 7% rise in compliance responsibilities, an 8% increase in risk management oversight, and a 5% jump in ESG leadership landing on the CLO's desk 2025 ACC/MLA Benchmarking Report. As that mandate grows, so does the expectation that the GC can demonstrate strategic value on top of cost control, which is exactly why business-alignment metrics, the category most departments still skip, are the ones a CFO is increasingly likely to ask about directly. The expanded CLO mandate provides context for why business-alignment metrics are gaining weight.
Sources
- Corporate Legal Department Metrics: KPIs and CFO Scorecard — GC AI
- Legal operations metrics: A guide to data, metrics, and KPIs | Wolters Kluwer
- Legal Department KPIs in 2026: What to Actually Measure
- spendmatters.com
- legaldive.com
- CLOC Releases 2026 State of the Industry Report: Rising Legal Demand Outpaces Budget and Staffing Growth, Forcing Operational Shift - CLOC
- mlaglobal.com